Bridge topics · Expert session
Suspension Bridge Analysis: Initial Shape and Construction Stages
How the dead-load shape of an earth-anchored suspension bridge is found, how the construction stages are worked back from it, and what to check on the way: forces, profile, girder moments, saddle set-back and cable slip.
A suspension bridge is designed in its finished shape, but it is built from a bare cable that moves metres while the deck goes on. This expert session explains how the dead-load equilibrium shape of an earth-anchored suspension bridge is found, how the construction stages are worked back from it, and what has to be checked on the way: cable and hanger forces, the deck profile, girder moments, saddle set-back and cable slip. A three-span bridge of 183 + 750 + 183 m is used as the worked example throughout.
Why a suspension bridge is analysed backwards
A girder bridge is analysed forward: build the model, apply the loads in the order they arrive, read the deflections and set the camber as the dead-load deflection with its sign reversed. A suspension bridge cannot be treated this way, for two reasons.
- The cable takes its shape from the load. Under its own weight and the weight of the deck, the main cable moves by metres, and the stiffness of the whole structure depends on the cable tension, which only exists once the dead load is on it.
- The finished shape is fixed in advance. The deck profile, the cable sag and the positions of the saddles and anchorages are set by the design. These are the targets. What is not known is the geometry and the unstressed lengths of the cable and hangers that produce them.
So the analysis starts from the end. First it finds the equilibrium state of the completed bridge under its dead load: the initial shape analysis, also called the initial equilibrium or form-finding analysis. Then it works out how the bridge gets there, stage by stage: the construction stage analysis.
How an earth-anchored suspension bridge carries load
The weight of the deck and the cable goes from the deck to the hangers, from the hangers to the main cable, and from the cable to the towers and the anchorages. The towers take the vertical component. The anchorages take the horizontal pull of the cable, the horizontal force H, into the ground. That is what makes a bridge earth-anchored. In a self-anchored suspension bridge the cable is anchored in the ends of the deck, so the deck carries H in compression and has to be built before the cable is loaded. Sorok Bridge in Korea (110 + 250 + 110 m, completed in 2008) is an example, and the country's first self-anchored suspension bridge with a single main cable; see self-anchored suspension bridges.
In an earth-anchored bridge the deck carries no axial force from the cable. The cable, a pure tension member, carries almost all of the vertical load, and the deck only spreads it between hangers. The long natural periods also make the type favourable under earthquake loading. With better aerodynamic design and stronger wire, main spans of 3,000 to 4,000 m are considered within reach.
For a cable carrying a uniform load w per metre of span, the parabola gives the basic relations:
L is the span, f the sag and S the cable length. A sag ratio of 1/9, typical of modern bridges, gives a sag of about 83 m on a 750 m main span, and a cable about 3.3% longer than the span, roughly 775 m. A flatter cable means a larger H, a heavier cable and bigger anchorages; a deeper sag means taller towers.
Nonlinear behaviour, and why live load can still be linear
Most structures soften as they are loaded: the deflection grows faster than the load. A cable does the opposite. It stiffens as it is loaded, because the tension that resists further deflection grows with the load. This geometric hardening is large under dead load, so the dead-load state has to be found by a nonlinear analysis with large displacements.
Once the dead load is on, the cable is highly tensioned and the structure behaves almost linearly for further load. Live load can therefore be analysed with a model linearised about the dead-load equilibrium state, whose stiffness includes the geometric stiffness from the cable tension. That makes influence lines and the superposition of load cases possible. A fully nonlinear live-load analysis gives slightly smaller deflections than the linearised one, so the linearised result is on the safe side.
Continuum theory and the finite element method
| Continuum (deflection) theory | Finite element method | |
|---|---|---|
| Basis | Differential equations written for the suspension bridge as a whole, solved with suitable boundary conditions | The structure divided into elements, using the basic assumptions of suspension bridge behaviour |
| Strength | Clear physical insight; fast for preliminary design | Any configuration: three-dimensional, floating decks, centre clamps, multiple spans |
| Superposition | Not possible, the equations are nonlinear | Possible on the linearised model: influence lines and load combinations |
| Use today | Checks and concept design | Detailed design and construction engineering |
A finite element model of a suspension bridge needs:
- The right elements. Towers and deck as beam elements; the main cable and the hangers as cable elements, either elastic catenary elements or nonlinear tension-only truss elements.
- Three dimensions. A three-dimensional model that can run geometric nonlinear analysis. A fishbone model, with the deck as a spine of beams and rigid arms out to the hanger points, is common.
- Initial forces. The program must take the results of the initial shape analysis as initial member forces, so the linearised model starts from the right stiffness.
- Careful input. A small error in a coordinate or in the dead load becomes a visible error in the profile.
The initial shape analysis
The analysis starts from what the design fixes and solves for what the fabricator needs.
- Known: the deck profile, the sag of the main cable at midspan, and the positions of the anchorages (splay saddles) and the tower saddles.
- Unknown: the cable coordinates at every hanger point, every hanger force, the horizontal force and tension along the cable, and the unstressed lengths of cable and hangers.
The four stages
- Hanger loads. Work out the load each hanger carries. The simplest way is the 1:0 method: each deck panel is taken as simply supported between hangers, so each hanger carries the dead load of the deck on either side of it. Alternatively the deck is modelled as a continuous girder on rigid supports at the hangers and the support reactions are used.
- Cable and hangers only. Take the main cable and hangers alone, loaded by the hanger forces, and find the cable geometry that satisfies the known boundary conditions: anchorages, saddles and sag. This gives the cable coordinates and the unstressed lengths.
- Towers. Compute the axial force in each tower from the cable forces at the saddle, and the shortening it causes.
- The whole bridge. Assemble the complete model with towers, deck, cable and hangers at their unstressed lengths, and apply the dead load in a geometric nonlinear analysis. If the nodes move by more than a set tolerance, correct the coordinates and unstressed lengths and repeat. When the displacements under dead load are practically zero, the model is in equilibrium in its design shape.
The result is a model that, under its own dead load, stays where it was drawn. In a well-converged analysis the residual displacements are fractions of a millimetre: in the worked example below, 0.144 mm on a 1,116 m bridge.
The dead load is the most important input
The initial equilibrium state is decided by the dead load, so any error in it appears directly as a distorted deck profile. Each item should come from quantity take-offs, not from estimates.
- On the deck: the steel weight from a detailed take-off, inspection gantries and walkways, surfacing, barriers and railings.
- On the cable: the cable steel, cable bands, hand ropes, wrapping wire, the hangers and their fittings, and the cable inspection walkways.
The construction stage analysis
Two things make it necessary. As the bridge is erected, every stage must lead to the shape and forces found by the initial shape analysis, and the contractor needs target values for each stage to control the erection on site. The analysis checks:
- main cable and hanger forces at every stage;
- the displacements of key nodes, so the final deck profile is reached;
- bending moments in the deck girder while it is still discontinuous;
- the saddle set-back, and slip of the cable on the saddles.
Forward or backward
A forward analysis follows the real erection order: bare cable, hangers, then deck segments one by one. For a suspension bridge it is awkward. Each new member has to be installed tangent to the deformed structure with the right unstressed length, or it is forced into place and carries load it should not have. And with very large geometric nonlinearity, especially in the early stages when the cable carries little load, the iterations converge poorly.
The construction stage analysis of a suspension bridge is therefore normally a backward analysis. It starts from the completed bridge in its initial equilibrium state and removes members in the reverse order of erection: secondary dead load, then the closure segments, the deck segments and finally the hangers. Every stage comes from a state that is already in equilibrium, so the deflected shape stays continuous from stage to stage and the deck and cable deflections stay consistent with each other.
A typical erection sequence
- Towers, splay saddle piers and anchorages.
- Tower saddles placed at their set-back position.
- Main cable erection: pilot rope, catwalks, then air spinning or prefabricated strands; see suspension bridge cable erection.
- Cable bands and hangers.
- Deck erection, block by block.
- Deck closure.
- Secondary works: surfacing, barriers, fittings.
Deck erection and temporary hinges
Deck blocks are lifted from the water and hung from the hangers, usually starting at midspan and working towards both towers, with the side spans added from the anchorages and the gaps closed last. In the worked example the erection blocks were 40 m long and the erected deck grew in six steps.
Until the whole deck carries load, the cable keeps changing shape: steep where it is loaded, flat where it is not. A deck made continuous too early would be bent by these changes. The common answer is the all-hinge method: the joints between deck blocks are left as hinges during erection so that each block follows the cable, and they are made rigid only when the full dead load is on. This reduces both the peak hanger forces at the ends of the erected length and the girder bending moments. The blocks should also be lifted in an order that keeps cable slip at the saddles small.
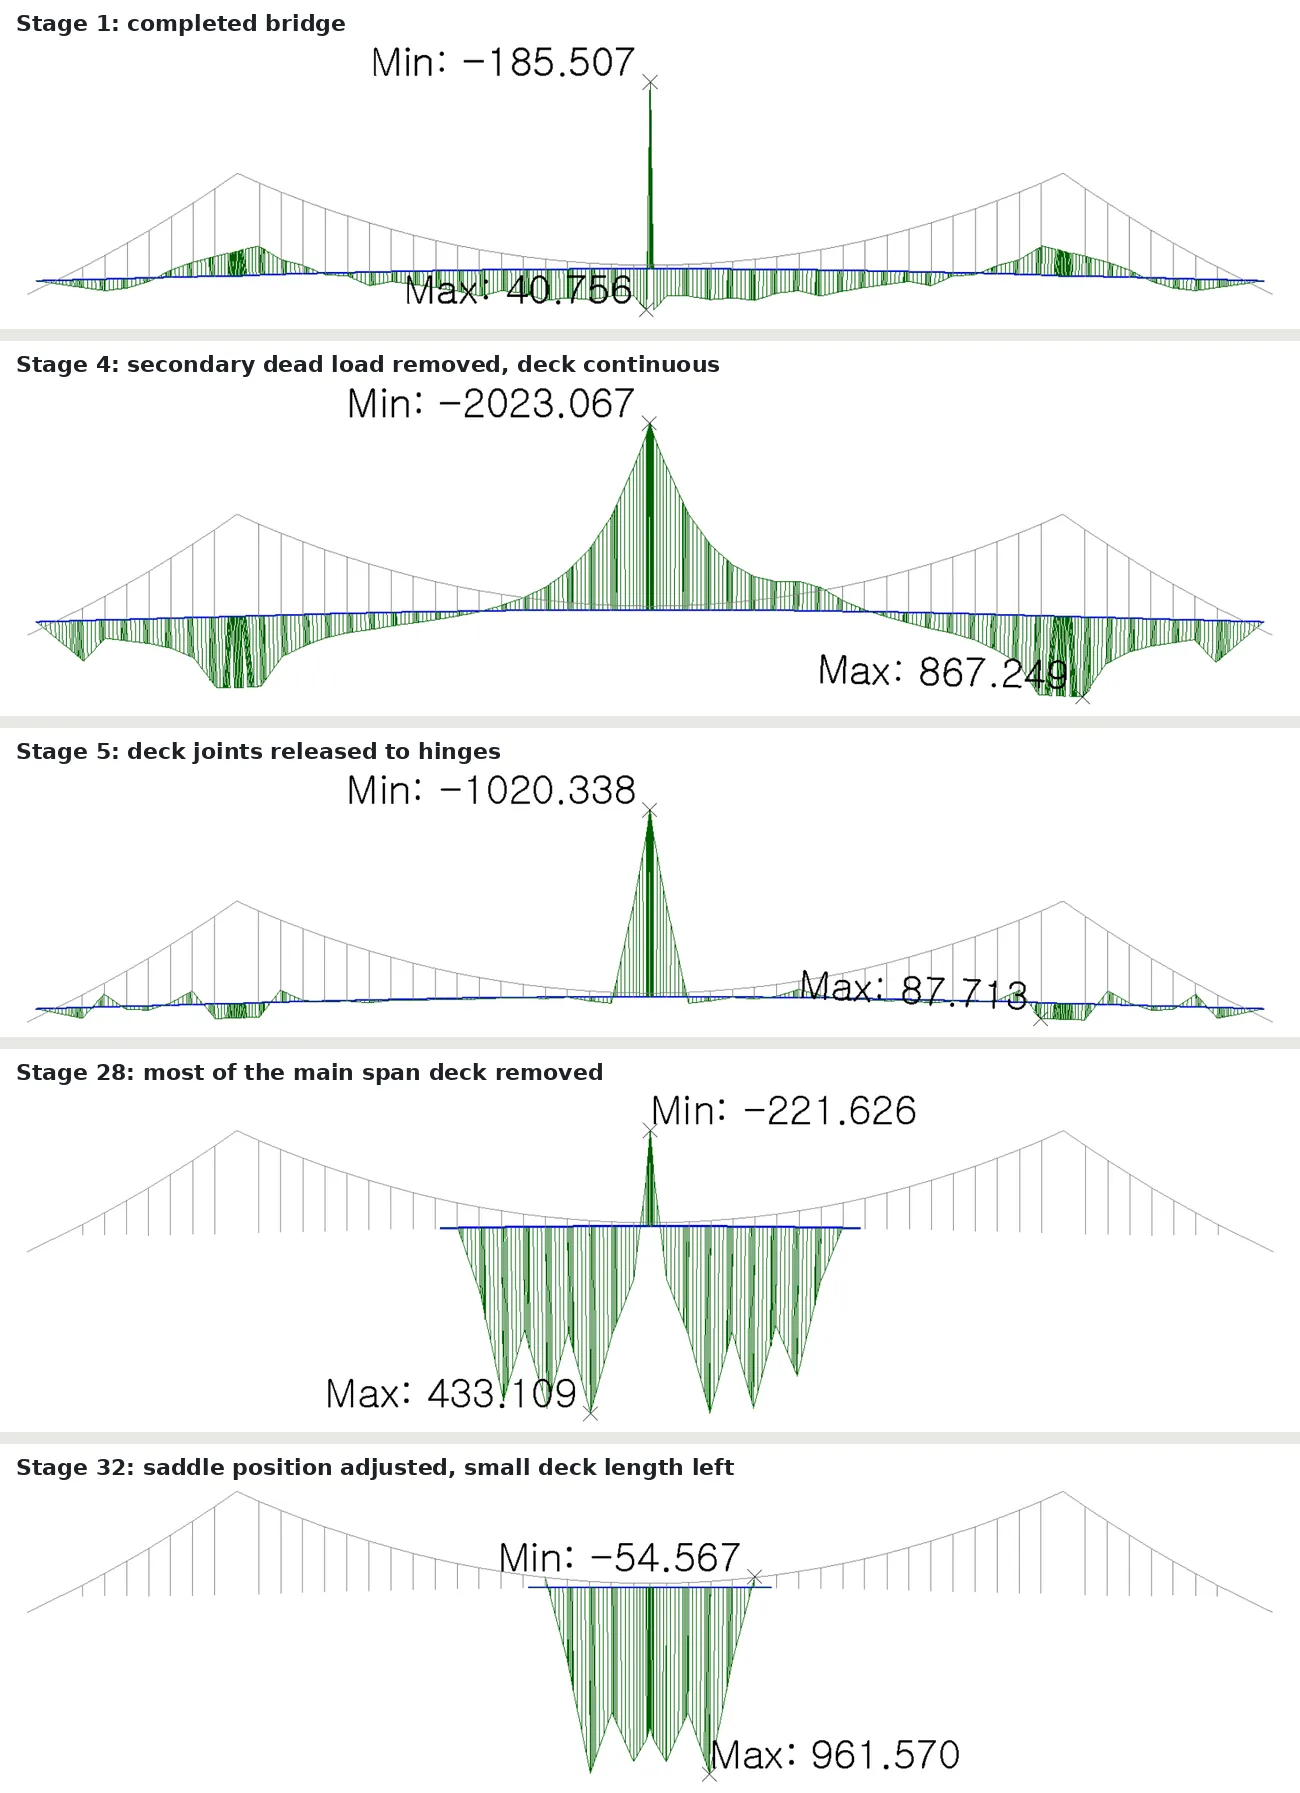
The moment diagrams of the worked example show how much this matters. With the deck continuous but without its secondary dead load (stage 4 of the backward analysis), the girder moment peaked at about 2,000 tonne-metres at the centre stay. With the joints treated as hinges (stage 5), the peak halved to about 1,000 tonne-metres. In the completed bridge the deck moments were in the tens of tonne-metres, apart from a local peak of about 190 tonne-metres at the centre stay. In the early erection stages, with only a short length of deck hanging from a lightly loaded cable, the hinged blocks sag between hangers and the moments in them grow again, to almost 1,000 tonne-metres.
Saddle set-back
In the completed bridge, the horizontal forces of the main span and the side span balance at each tower top, so the tower stands vertical without bending. During erection this balance does not hold. Before the deck goes on, the bare main span cable carries less load in proportion to its length than it will under the deck, and its horizontal force differs from the side span's. If the saddle were fixed at its final position, the tower top would be pulled over and the tower bent.
The saddle is therefore placed off its final position, towards the side span, by the set-back distance. As the deck is erected and the main span cable gains load, the saddle is jacked in steps towards the main span until it reaches its final position.
To compute the set-back, take the cable system at the bare-cable stage, remove the tower and put a roller under the saddle, and let the saddle move until the horizontal forces on both sides are equal. The movement found is the set-back. In the worked example it was 0.616 m, against 0.639 m from an independent program, a difference of 3.6%.
Cable slip at the saddles
Where the cable forces on the two sides of a saddle differ, the cable tends to slide over it, and only friction holds it. With T₁ and T₂ the cable tensions on either side, μ the friction coefficient and θ the angle of wrap over the saddle, the cable does not slip as long as T₁ / T₂ ≤ e^(μθ). The safety factor against slip is:
A friction coefficient of about 0.15 between the cable and the saddle is commonly used, with the required safety factor set by the design standard. Slip is checked at every stage, and the set-back steps and the deck erection order are chosen to keep the factor up. In the worked example the required factor during erection was 1.5. The least favourable stage was stage 38, where air spinning starts, with a factor of about 1.7 in both programs; at stage 33 the factor was about 4.3 to 4.9.
Worked example: a three-span floating suspension bridge
- Three-span earth-anchored suspension bridge in Korea, designed under a turnkey contract.
- Spans 183 + 750 + 183 m, 1,116 m between expansion joints; main span sag ratio 1/9 (sag 83.35 m).
- Two-lane road for 80 km/h, 16.88 m wide.
- Concrete towers 130.9 m high on caisson (well) foundations.
- Streamlined steel box girder in SM520 steel, 3.0 m deep, with its wind behaviour confirmed by CFD.
- Main cables by air spinning: 16 strands plus 2 extra strands in the side spans, 5 mm wire of 180 kgf/mm² (about 1,770 MPa), zinc paste and 3 mm S-shaped wrapping wire.
- Hangers of CFRC wire rope at 20 m spacing.
- A floating deck: no vertical bearings at the towers, only wind shoes for the transverse direction, a steel-frame centre stay tying cable and deck at midspan, pot bearings and buffers at the deck ends.
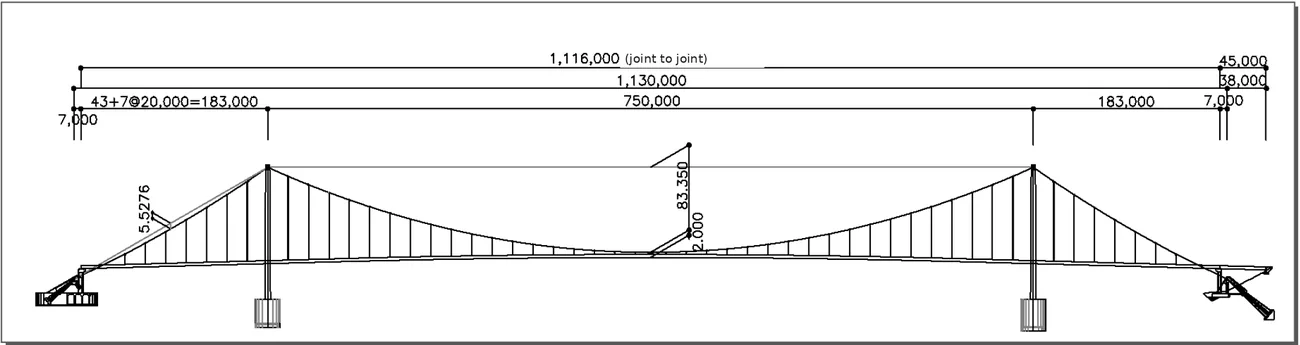
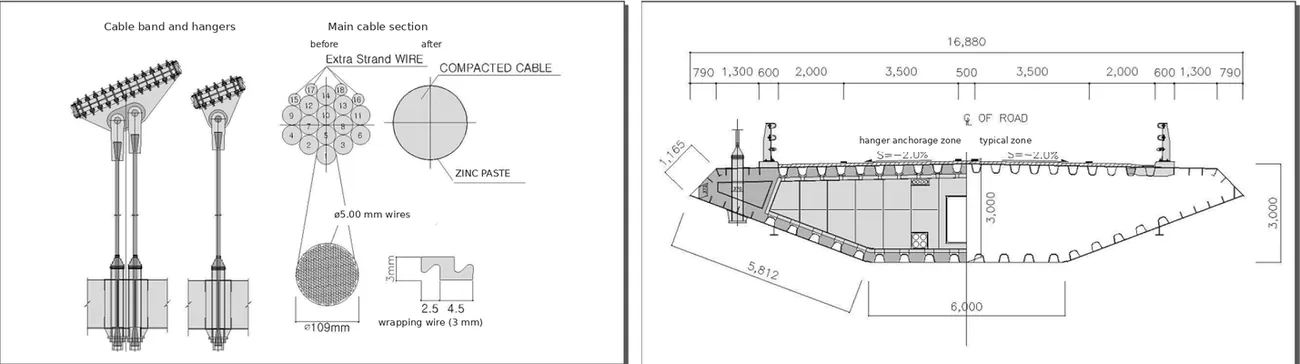
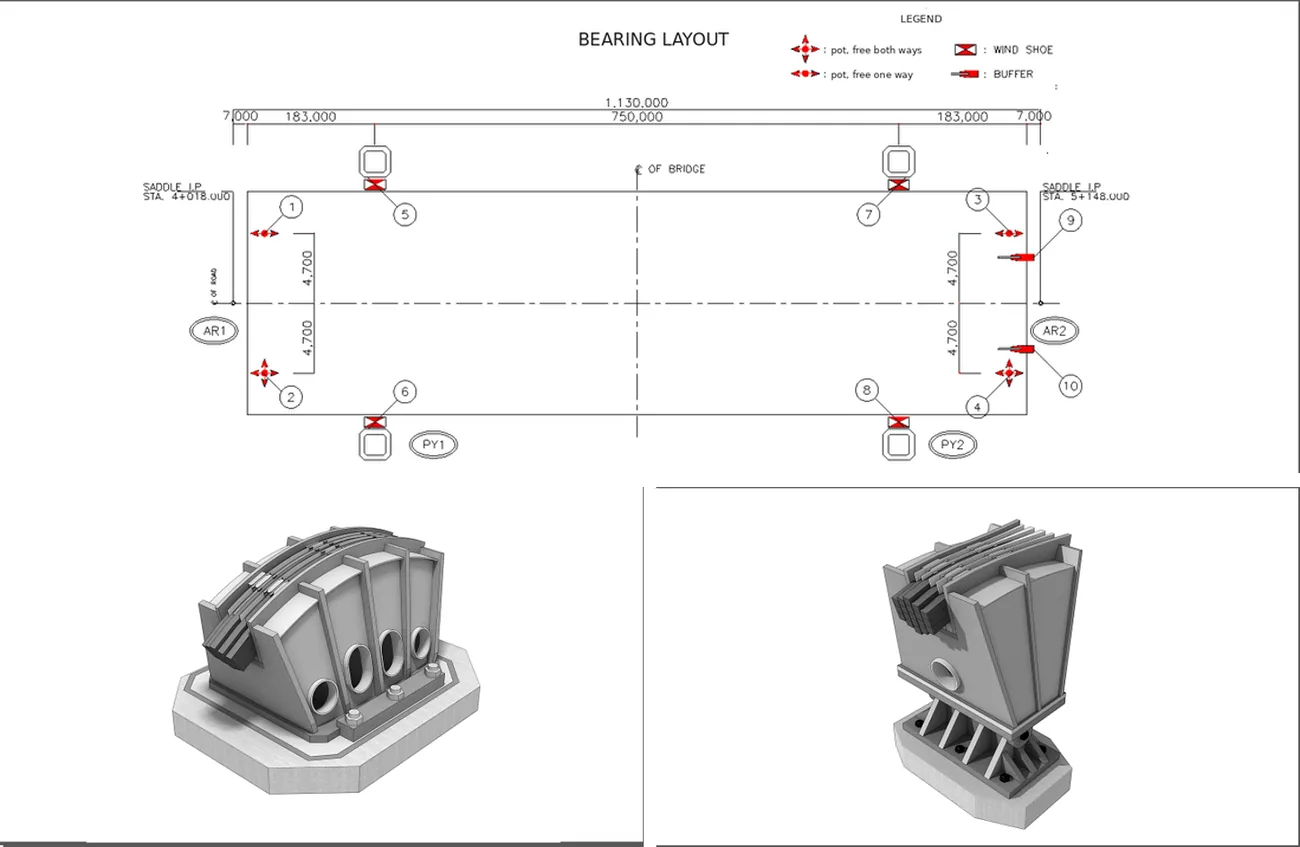
The model was a three-dimensional fishbone model built in its dead-load (design) shape, with beam elements for the deck and towers and elastic catenary elements for the main cables and hangers. Its results were compared with an independent analysis of the same bridge.
| Result | Difference between the two analyses |
|---|---|
| Main cable tension, initial shape | largest 0.75 tonnes (0.012%) |
| Hanger force, initial shape | largest 0.91 tonnes (1.33%), at the hanger next to the tower |
| Residual displacement after form finding | 0.144 mm |
| Main span quarter-point displacement during erection | up to about 0.09 m vertical and 0.02 m longitudinal (stage 22) |
| Cable and hanger forces during erection | under 1.62% |
| Saddle set-back | 0.616 m against 0.639 m (3.6%) |
| Safety factor against slip | within 1% at stage 38; up to 7.6% at stage 33 |
The two programs agree closely on forces. They differ by several centimetres on deflections in the middle stages, most at the stages with the lowest cable force, and the concentrated moment at the centre stay is where the deck models differ most. An independent check analysis, with different software and preferably by a different team, is worth its cost on every suspension bridge.
Practical points for construction engineering
- Fix the dead load from fabrication quantities before the cable is fabricated. A late change in surfacing or barriers changes the profile.
- Cable strands, hangers and girder segments are made to unstressed lengths. Hand them over with their reference temperature and reference tension.
- Survey the cable sag and the tower tops at night or at dawn, when the temperature is even, and correct for temperature and the actual tower positions before adjusting strands.
- Give the site a target for every stage covering the cable sag, tower top position, saddle position and deck profile, with tolerances and the temperature correction.
- Plan the saddle jacking steps together with the deck erection, and check the slip factor before each move.
- Rerun the analysis with the actual weights and survey data as erection proceeds. This is the basis of geometry control.
Related on TheBridgeEng
Questions engineers ask
- What is the initial shape analysis of a suspension bridge?
- It finds the cable geometry, the cable and hanger forces and the unstressed lengths that put the completed bridge, under its own dead load, exactly in its design shape. It is iterative: hanger loads, then the cable and hanger system, then the towers, then the whole bridge in a nonlinear analysis until the nodes no longer move.
- Why is the construction stage analysis of a suspension bridge done backwards?
- Starting from the completed equilibrium state and removing members in reverse order keeps every stage in equilibrium and avoids the convergence problems of a forward nonlinear analysis that starts from a lightly loaded cable. A forward check with the unstressed lengths confirms the result.
- What is saddle set-back?
- The offset of the tower saddle towards the side span during cable erection. The saddle is jacked to its final position in steps as the deck is erected, so unbalanced cable forces do not bend the tower.
- How is cable slip on a saddle checked?
- The cable does not slip while T1/T2 is no more than e to the power of mu times theta, with T1 and T2 the cable tensions on the two sides, mu the friction coefficient (about 0.15 is common) and theta the wrap angle. The safety factor is mu theta divided by ln(T1/T2).
- What is the difference between earth-anchored and self-anchored suspension bridges?
- An earth-anchored bridge anchors its main cables in the ground through anchorage blocks, so the deck carries no axial force from the cable. A self-anchored bridge anchors them in the deck, which carries the horizontal cable force in compression and has to be built first.
Updated 2026-10-30 · written by a practising bridge engineer